Southwest Florida’s housing market finished November 2025 with firm momentum and a very different feel than a year ago. Pending and closed sales were higher than November 2024, even as prices eased slightly and inventory remained elevated. Buyers now have more choice and negotiating power, while sellers are adjusting to longer marketing times and a more data-driven, price-sensitive environment.
Across the region, November’s results largely matched the cautiously optimistic outlook we shared in October. Pending sales jumped, closed sales improved and inventory growth slowed—signs that the market is rebounding, not retreating, as we head into the 2025–2026 winter season.
Watch the November 2025 Market Stats Videos
Naples Area Market Stats – November 2025
Bonita Springs-Estero Market Stats – November 2025
November 2025 at a Glance
Dig into the full November data:
• November 2025 Fast Stats (PDF)
• Monthly Indicators Report – November 2025 (PDF)
Looking for historic reports and additional charts? Visit our Market Reports page to browse previous months and years.
November Momentum Matches October’s Forecast
Region-wide, November showed the follow-through we were hoping for after a solid October. Pending sales climbed to roughly 3,600 contracts, a gain of more than 20% year-over-year, while closed sales improved by around 6% compared with November 2024. New listings, by contrast, were lower than a year ago, meaning existing inventory had to carry more of the load. That combination—stronger demand on a smaller inflow of new listings—helped absorb some of the excess supply that built up earlier in 2025.
Statewide commentary from Florida Realtors® has turned more upbeat as well. President Tim Weisheyer recently noted that Florida’s housing market is showing “strength and balance,” with closed sales and pending inventory running ahead of last year as prices ease back to more sustainable levels. That description fits Southwest Florida in November: activity is stronger than 2024, but not overheated, and buyers and sellers are trading blows in the year-to-date stats rather than one side clearly dominating.
“Closed sales and pending inventory were higher this fall than a year ago… With median prices easing, more buyers are stepping back in, and sellers are finding a more stable environment to list.”
The year-to-date numbers underline how tight the race has been. Through November, total closed sales across Southwest Florida remain down mid-single-digits compared with 2024, while new listings are slightly higher and the year-to-date median price is only about 1% lower. Put simply, 2025 has been a stalemate year—until this fall, when buyer activity finally began to tilt the momentum back toward a healthier pace of transactions.
Prices Ease in Bonita, Naples and Fort Myers
The flip side of that stronger activity is gentle price softening. The overall regional median sale price in November registered around $354,450—about 1% lower than last November. That’s not a crash; it’s price discovery after several years of rapid appreciation.
By area, the story is nuanced:
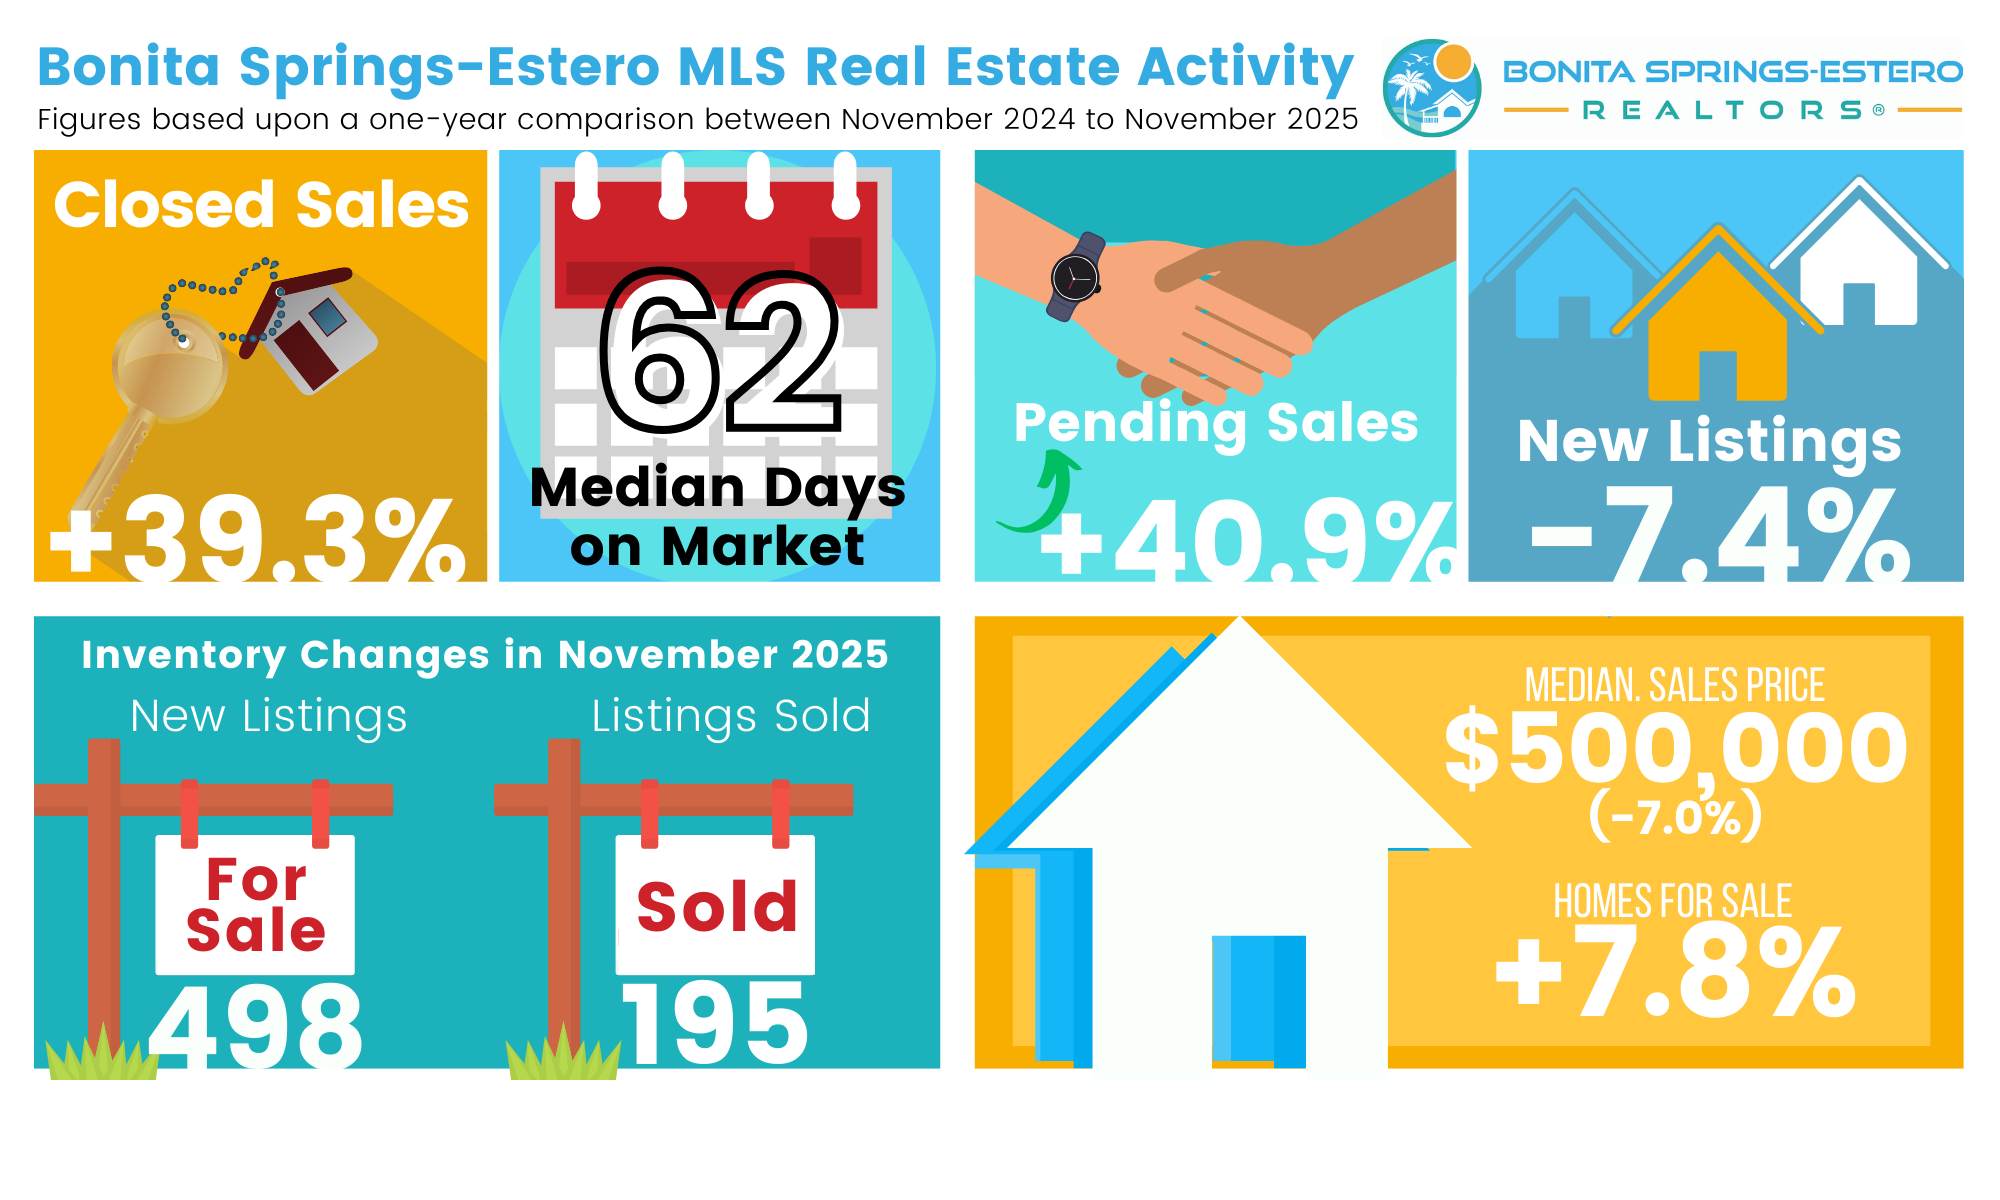
- Bonita Springs-Estero: The median sale price sits around $500,000, down roughly 7% year-over-year but still well above 2021 levels. Inventory and months of supply are elevated, so buyers have choices and room to negotiate.
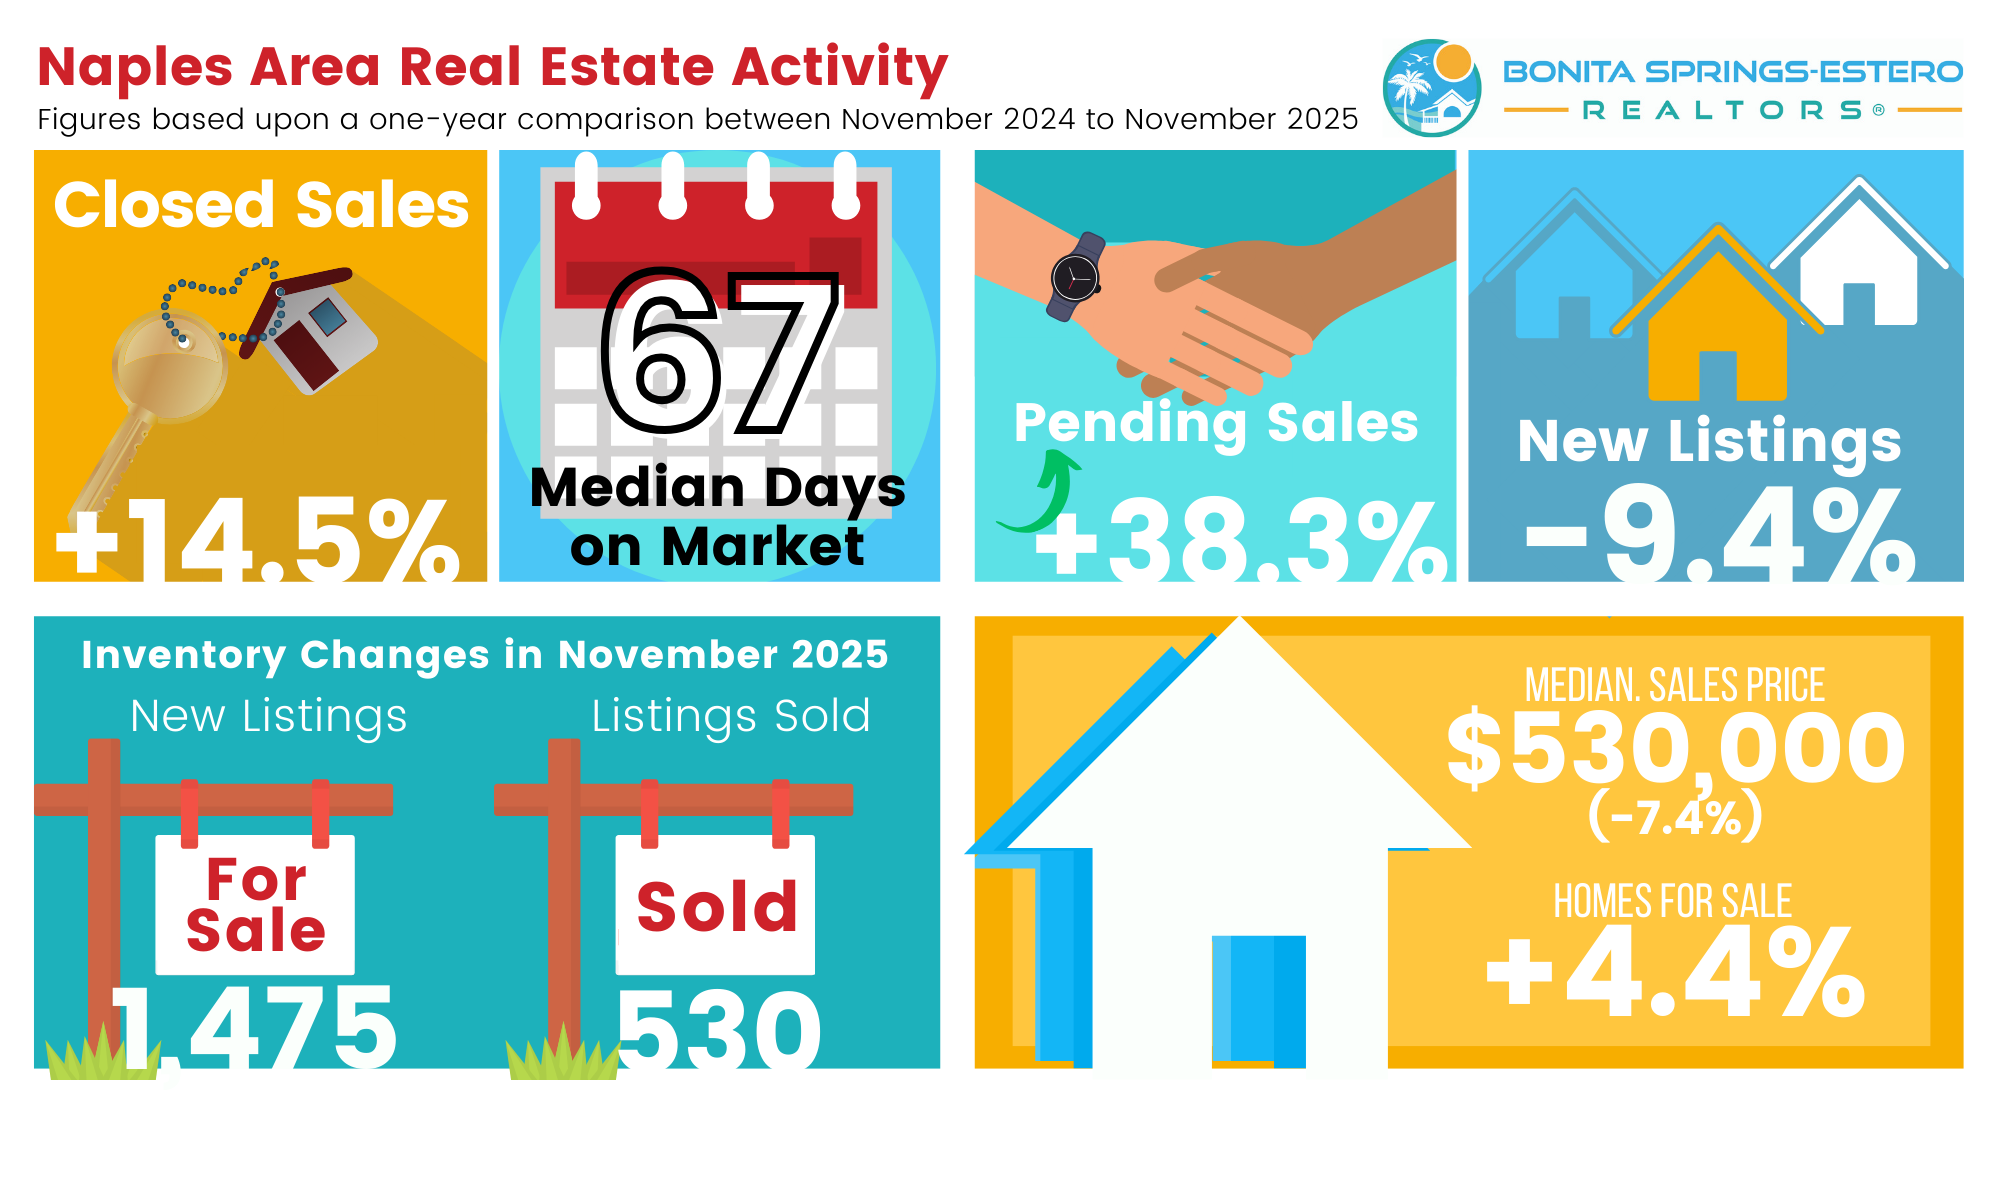
- Naples: Naples saw a larger adjustment, with the November median near $530,000 and off about 7–8% from November 2024. Even so, prices are still more than 10% higher than they were four years ago.
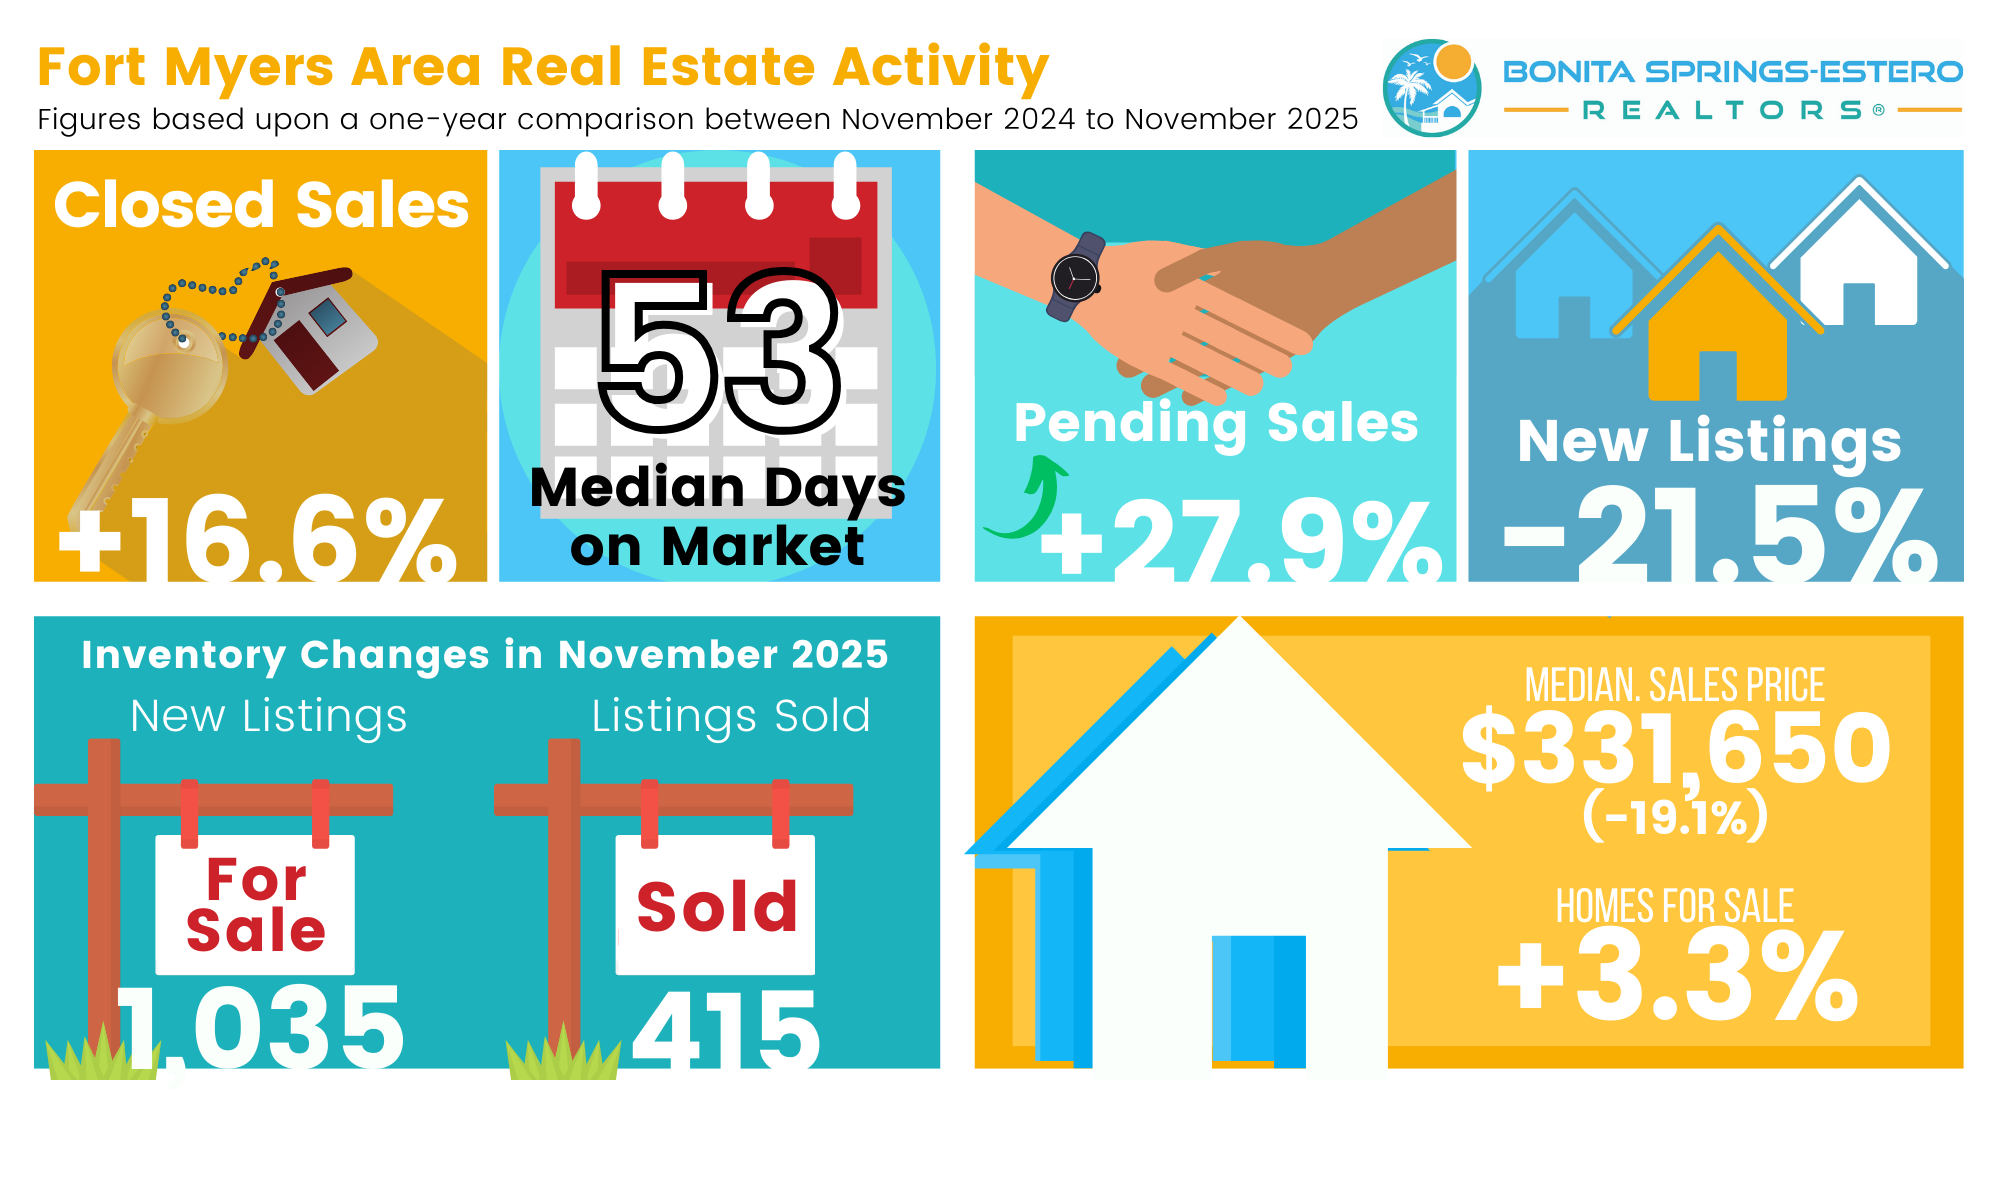
- Fort Myers Area: Fort Myers experienced the sharpest reset, with the median near $331,650—roughly 19–20% lower than last year—after a big run-up in 2023–2024. New listings also fell about 21.5% compared with last November, so much of the adjustment is happening through price rather than a surge of fresh supply. That drop has significantly improved affordability in many neighborhoods.
For context, the five-year charts in our November reports show that even with these declines, median prices in Naples and Fort Myers remain well above 2021 levels. Long-time owners still hold substantial equity; it is the short-term peaks of 2022–2023 that have been trimmed back. Local brokers describe it as a “give-back of the froth,” not a fundamental collapse in values.
“Even with short-term price fluctuations, this remains one of Florida’s strongest and most stable real estate markets.”
The practical takeaway for sellers is that pricing strategy matters more than ever. Overpricing leads to longer days on market and larger eventual discounts. Well-positioned homes—clean, updated, and priced near the current median for their segment—are still drawing serious buyers and solid offers.
Inventory and Days on Market: A High-Choice Environment
Inventory remains the headline driver of today’s buyer-friendly conditions. Across Southwest Florida, there were just over 27,000 homes for sale at the end of November, up about 6–7% from last year and several times higher than the ultra-tight 2021 levels. Months of supply sits near 12.0, roughly double what the National Association of REALTORS® considers a “balanced” market.
More supply has translated directly into longer marketing times. The median days to contract in November reached 62 days, compared with just over 50 days a year ago. Sellers are averaging around 94% of their original list price at closing, a sign that price cuts or negotiated concessions are once again standard practice.
Importantly, inventory growth is no longer accelerating. In the single-family segment, months of supply has actually eased from its peak as strong fall sales have chipped away at the backlog. Condo supply remains higher, especially in some investor-heavy communities, but even there the pace of new listings has slowed. We appear to be in a “high-choice but stabilizing” environment rather than a runaway oversupply scenario.
“The market is displaying mixed signals typical of a shifting environment—while new listings and pending sales both increased significantly, homes are taking longer to sell.”
For buyers, this means breathing room: more options to compare, less pressure to make instant offers, and greater leverage on price and terms. For sellers, it means being realistic about the competition and working closely with a REALTOR® on pricing, presentation, and timing.
Rate Cuts and Mortgage Rates: Cautious Optimism
National monetary policy has finally started to help rather than hurt the housing market. In early December, the Federal Reserve approved its third rate cut of 2025, bringing the federal funds rate down by another quarter-point after two earlier cuts. The move reflects easing inflation and a desire to support growth without reigniting price pressures.
Mortgage rates, however, don’t move in lockstep with Fed decisions. They are driven primarily by longer-term bond yields and investor expectations. After the latest cut, 30-year fixed mortgage rates have been hovering in the low- to mid-6% range—down from peaks above 7.5% earlier in the year, but still higher than the ultra-low pandemic levels.
Economists expect gradual, not dramatic, progress from here. Analysts like LendingTree’s Matt Schulz have emphasized that borrowers shouldn’t expect mortgage rates to “plunge” after each Fed cut, but agree that a sustained move below 6% would likely spur a new wave of refinances and home purchases. NAR Chief Economist Lawrence Yun has likewise pointed out that stabilizing or gently falling rates tend to unlock pent-up demand, especially from move-up buyers who have been reluctant to trade in older 3% mortgages for much higher rates.
“Every half-point drop in mortgage rates gives thousands more households the ability to afford a home. That’s when you see meaningful increases in contracts and closings.”
On the ground in Southwest Florida, we are already seeing the psychological effect of lower rates. Many buyers who pressed “pause” in 2024 have come back into the market this fall, hoping to catch a window where prices have softened, rates are off their highs, and inventory is plentiful. Sellers, in turn, are gaining confidence that there is real demand for fairly priced homes, even if marketing takes longer than it did during the frenzy years.
Buyer Demand and Seller Negotiation Dynamics
Several November indicators highlight the shift in buyer and seller psychology:
- Pending sales—a forward-looking measure of new contracts—were up more than 20% year-over-year, confirming that buyers are no longer in “wait and see” mode.
- Closed sales also improved compared with November 2024, even though new listings were down, which means existing inventory is being actively absorbed.
- Percent of original list price received has slipped into the 94–95% range, indicating that sellers are giving typical discounts of about 5–6% from their initial asking prices.
- Days on market have stretched to around two months on average, but well-priced, well-presented homes still sell noticeably faster.
Buyers are taking advantage of this environment by being more selective and negotiating harder. Many are scheduling multiple showings, comparing HOA fees, insurance costs, and property condition, then making strong offers on the homes that best fit their criteria. Contingencies—inspection, appraisal, financing—are back in force.
Sellers, meanwhile, are coming to terms with the new normal. The first offer is often worth serious consideration, even if it’s slightly below asking, because it may be the best one they receive for some time. Local agents describe today’s market as a “courtship” again rather than a lightning-fast auction: both sides have to move thoughtfully, and both can come away with a win if expectations are properly aligned.
Key Indicators & Interactive Market Graphs
To make sense of this more complex market, it helps to watch a handful of key indicators over time rather than focusing only on this month’s median price. Below are four interactive charts you can use to explore current trends at a glance:
- Months of supply of inventory – how far above or below a balanced six-month market we are.
- Median days on market – how long it typically takes for a home to go under contract.
- New listings vs. pending sales – how quickly demand is absorbing new supply.
- Median sales price by area – how Bonita/Estero, Naples, Fort Myers and the region compare.
The sample graphs below use recent regional data and approximate monthly trends. Your REALTOR® can help you interpret the patterns and overlay your specific neighborhood or price segment.
Months of Supply vs. Balanced Market
Southwest Florida has been running well above the 6-month “balanced” level, giving buyers abundant choice.
Median Days to Contract
Marketing times have lengthened from the fast pace of 2021–2022, but well-priced homes still move.
New Listings vs. Pending Sales
When pending sales meet or exceed new listings, inventory shrinks and conditions gradually tighten.
Median Sales Price by Area – November 2025
A snapshot of November median prices for the region and three key sub-markets.
Watching these indicators month over month will help you see whether conditions are easing or tightening. Is inventory drifting down or up? Are homes selling faster or slower? Are sellers getting closer to asking price or farther away? In a high-choice, negotiation-heavy market like we have now, having that context can make the difference between guessing and making a well-timed, well-priced decision.