Executive Summary
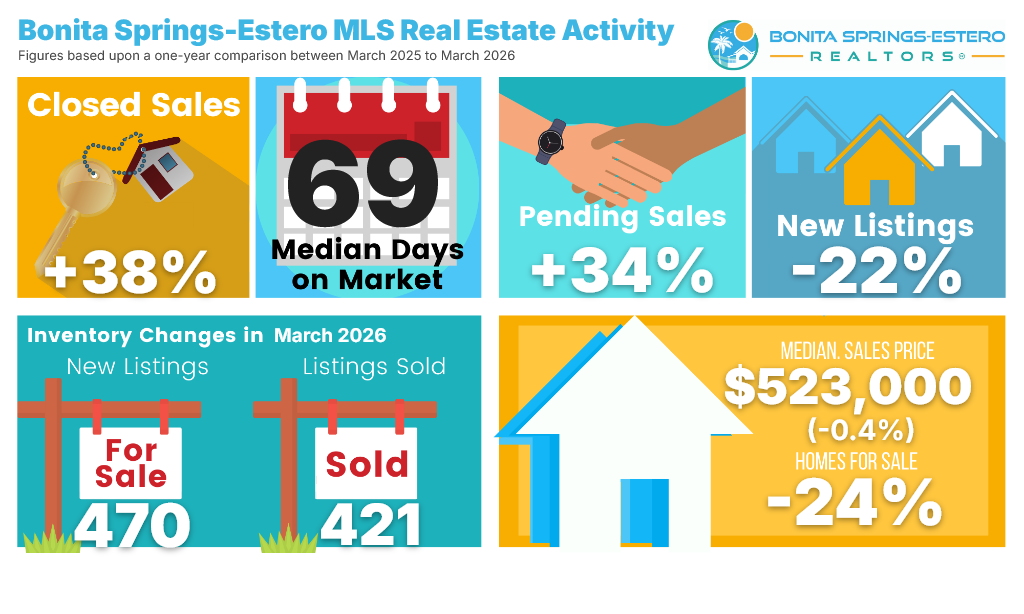
March 2026 delivered a clear peak-season signal across Southwest Florida: closed sales rose sharply in key markets while new listings fell, tightening inventory and compressing months of supply. In the Bonita Springs–Estero MLS area, closed sales jumped 38% year-over-year and pending sales rose 34%, even as new listings declined 22%.
Meanwhile, Naples and Fort Myers both posted higher closings but showed larger year-over-year median price declines, reinforcing that buyers are engaging when pricing is competitive and realistic. The most consistent story is not “prices are soaring again,” but “the market is clearing more efficiently”—more contracts, fewer new listings, and a tighter supply environment heading into spring.
Key Metrics Snapshot
March in the Southwest Florida Fast Stats dataset showed improving demand against reduced listing flow—classic spring absorption conditions. (Lee/Collier/Hendry combined)
Southwest Florida Single Family (Mar '26 vs Mar '25)
New Listings
Pending Sales
Closed Sales
Median Sale Price
Months Supply
Inventory
Southwest Florida Condo (Mar '26 vs Mar '25)
New Listings
Pending Sales
Closed Sales
Median Sale Price
Months Supply
Inventory
BER Fast Stats: March 2026
The market’s demand-and-supply dashboard for single-family and condos.
Editorial Note: Percent changes in market reporting use rounded figures and can sometimes appear extreme during periods of rapid adjustment. This is a built-in feature of standard reporting meant to highlight direction, but should be interpreted alongside total volume for the most accurate view.
Regional commentary: Bonita Springs + Estero
Bonita Springs and Estero tightened substantially year-over-year on months supply, a meaningful change from the “inventory rebuild” narrative that dominated earlier phases of the rebalance. The combined area posted 4.5 months of supply (down 44.3% YoY), while Bonita Springs was at 5.3 and Estero at 3.6—indicating a notably tighter competitive set in Estero.
That tightening helps explain why Bonita/Estero could post a major volume increase (+38% closings) while the median price remained essentially flat (-0.4%). When pendings outpace new listings growth, inventory compresses quickly, as seen in the 24% decline in homes for sale.
Closed sales show the spring-season conversion from winter pendings. (Jan 2019 - Mar 2026)
“Bonita + Estero: homes for sale vs closed sales, median price history, and supply of inventory show a market achieving higher volume without new price peaks.”
A notable “market-shape” outlier observed in March is that buyers are moving faster than sellers are replenishing supply: in both single-family and condos, pending sales rose far more than new listings, driving the inventory compression visible in the Fast Stats tables.
Regional commentary: Naples and Fort Myers
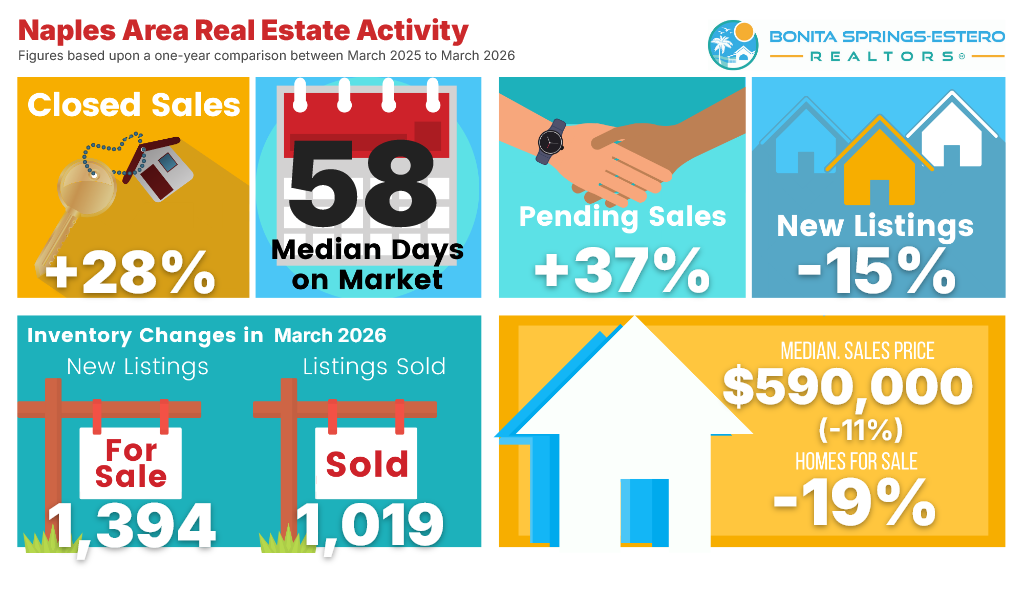
Naples is March’s clearest “price-to-clear” example: closings rose 28% YoY while the median price declined 11% YoY to $590,000, and new listings fell 15%. This fits a market where sellers meet motivated buyers at competitive pricing—especially after 2024–2025’s broader normalization.
Micro-market outlier: Naples’ March median price decline (-11%) occurred alongside a +28% lift in closings, which supports the “pricing met the market → transactions cleared” narrative more strongly than a “hot market = rising prices” trend.
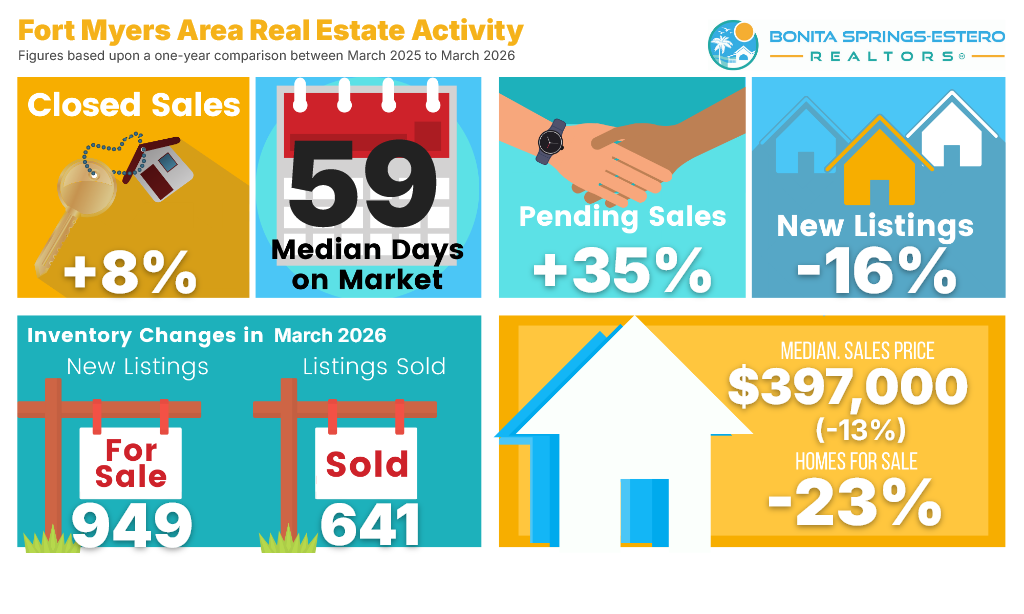
Fort Myers showed a smaller closing increase (+8%) but a larger median price decline (-13%), suggesting the affordability-oriented segments remain more price elastic. Both markets showed significant inventory compression (-19% to -23%), pointing to a region-wide tightening of supply.
Supply is tightening versus last year, but remains above the 2021–2022 scarcity period.
Price Distribution: Where deals actually closed
The March price-bin distribution suggests the rebound is broad-based. Roughly 62% of closings occurred under $600K, and the single largest bin was $200K–$399K (~30% of closings). This confirms that demand was not confined to luxury; instead, improved pricing and selection created transaction volume across core "everyday" price tiers.
| Price Range | Closings | Share of Closings |
|---|---|---|
| <$200K | 175 | 8.3% |
| $200K–$399K | 631 | 30.1% |
| $400K–$599K | 501 | 23.9% |
| $600K–$799K | 283 | 13.5% |
| $800K–$999K | 144 | 6.9% |
| $1M–$1.9M | 199 | 9.5% |
| $2M–$2.9M | 84 | 4.0% |
| $3M–$4.9M | 46 | 2.2% |
| >$5M | 35 | 1.7% |
A key nuance: While the $1M+ segment represented roughly 17% of transactions, these high-end closings often represent a disproportionately large share of total sold volume. This helps explain why sold dollar volume can rise even when median prices are flat-to-down.
The majority of March closings occupied the mid-market ranges ($200K-$600K).
Why this bump is happening: Testing the Drivers
1. Pricing Realism Meets the Market
Median prices were flat-to-down in every major area infographic, with the steepest declines in Naples and Fort Myers. Simultaneously, pending sales surged mid-30%+. This creates the simplest transaction story: competitive pricing pulled demand forward as sellers met motivated buyers.
2. Mortgage Rates as a "Certainty Cue"
Freddie Mac’s surveys shows late-March 30-year rates in the mid-6% range. The Fed held rates steady in March 2026. This stability—rather than a dramatic drop—reduced buyer hesitation. When buyers stop expecting near-term relief, they shift from "wait" to "negotiate."
3. Equity and Volatility
Stock market turbulence in early 2026 may have acted as a sentiment tailwind, but the broad price-range distribution suggests it wasn't the sole driver. The structure of the month (pendings up, listings down) already explains most of the volume lift through seasonal demand.
Prices stay selective while marketing time remains normalized. (Jan 2019 - Mar 2026)
Economic Context: Local Fundamentals
Inflation is currently moderate, with the Consumer Price Index increasing 2.4% for the 12 months ending February 2026. Local fundamentals provide supportive background: covered wages in Lee and Collier were rising as of Q3 2025 (~3.0% to 4.3% YoY). However, local wage levels ($28-$30/hr) remain below U.S. benchmarks, reinforcing that SWFL sales volume is still heavily influenced by migration and equity buyers.
Video Insights: Market Update Commentary
Market Takeaways: Normalization of inventory (3.6 to 6.2 months) and significant price corrections in Naples (-11%) highlight a transition toward buyer leverage.
January Outlook Check: On Track?
Our January framework emphasized watching pendings vs new listings and expecting a "selective but active" market. March data aligns strongly: high-season activity materialized, inventory compressed as predicted, and rates hovered in the low-to-mid 6% band. The divergence was in micro-market pricing—Bonita/Estero held firm while Naples and Fort Myers adjusted more aggressively to clear volume.
Outlook: Next 60–120 Days
If the “pendings up / listings down” pattern holds into April and May, closings can remain elevated. For sellers, the March data encourages pricing to the competition you have today. For buyers, the opportunity is to move faster in "tightening pockets" where supply is falling fastest.
Local Media Cross-Check & Alignment
While local commentary may describe varying nuances, there is broad alignment on the core direction: contracts are up, inventory is tighter than last year, and buyers remain highly price-sensitive. Clarification of Source: The figures in this update are sourced directly from the Bonita Springs–Estero REALTORS® MLS reporting system and standardized monthly reporter set. Brokerage commentary may utilize different geographical boundaries or rolling averages.
Data sources include Bonita Springs-Estero
REALTORS® dashboard, Florida Realtors, and BLS.
For additional
context, download the March 2026 Monthly Indicators report.