
(Lee, Collier, and Hendry Counties — plus Bonita Springs/Estero, Naples, and Fort Myers)
February delivered a clean high-season signal: more buyers wrote contracts, more deals closed, and overall supply tightened year-over-year—but the market is still behaving like a “disciplined” environment where pricing accuracy matters. Region-wide, pending sales rose to 4,986 (+27.7% YoY) and closed sales increased to 2,866 (+12.8% YoY) while new listings fell to 6,305 (-12.5% YoY). Inventory also moved lower (28,689 homes for sale, -9.4% YoY) and months of supply improved to 12 months (down from 13, -9.7% YoY).
“Closings and median price rose year-over-year while inventory declined across Southwest Florida.”
The most “tell me what matters” outlier this month is the gap between contract activity and supply coming to market:
| Metric | Value | YoY Change |
|---|---|---|
| New Listings | 6,305 | -12.5% |
| Pending Sales | 4,986 | +27.7% |
| Closed Sales | 2,866 | +12.8% |
| Median Sale Price | $363,523 | +4.3% |
| Median Days on Market | 60 | +22.8% |
| Homes for Sale | 28,689 | -9.4% |
| Months of Supply | 12 | -9.7% |
“Southwest Florida (Lee/Collier/Hendry) year-over-year snapshot.”
A practical way to read momentum: February posted roughly 1.74 pending sales for every closed sale (4,986 pendings vs. 2,866 closings), which typically supports stronger closings in the next 30–90 days if normal fallout rates hold.
February’s “rebalance” continues, but it’s not uniform—condos are moving on price sensitivity, single-family is tightening, and land is lagging.
Single-family showed classic high-season tightening: new listings -13.9% YoY, pendings +30.2%, closings +12.6%. Inventory declined -16.4% and months of supply improved to 7.9 months. Median price held flat at $455,000—a “buyers are active, but not rewarding overpricing” signal.
Condos were the volume outlier: pending sales +38.2% YoY and closed sales +41.0% YoY. At the same time, median price declined to $363,000 (-5.7% YoY) and median days on market increased to 69 (+16.9% YoY). That combination usually means: buyers are stepping in where pricing (or concessions) matches the new normal.
Land remains the most buyer-leaning segment: closed sales -20.1% YoY, pending sales -3.6%, inventory +8.1%, and months of supply rose to 19 (+35.4% YoY).
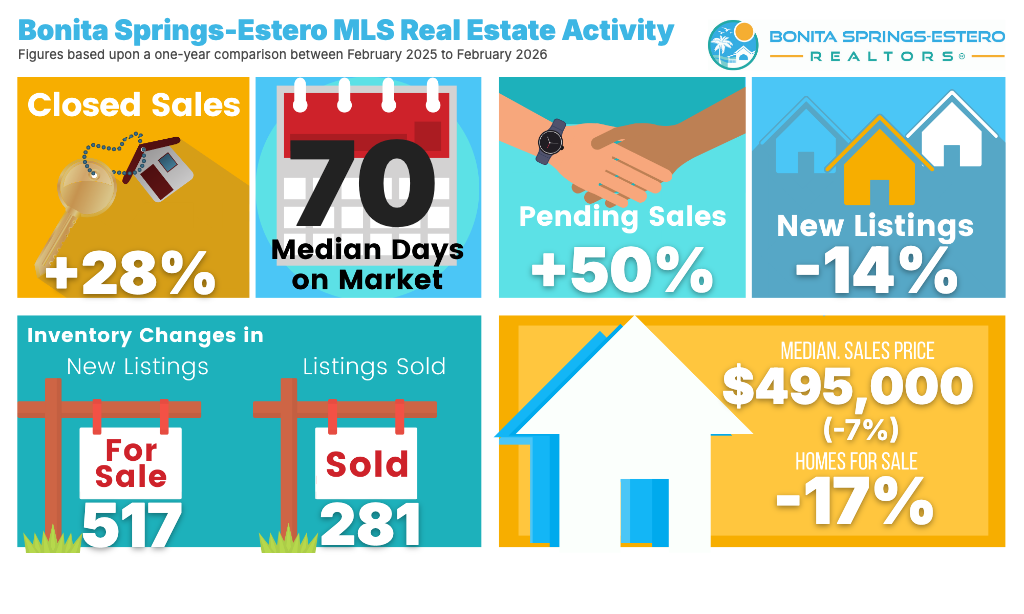
February’s micro-market story is best told as stronger activity with tighter supply—alongside a median price that depends heavily on mix.
New Listings: 517 | Sold: 281
Those numbers match the broader theme in the regional data: demand improved meaningfully while listing flow pulled back.
A key nuance: when closed sales rise while months of supply falls, the market is tightening—even if the median price doesn’t rise in tandem. That’s why February reads as “more deals, disciplined pricing.”
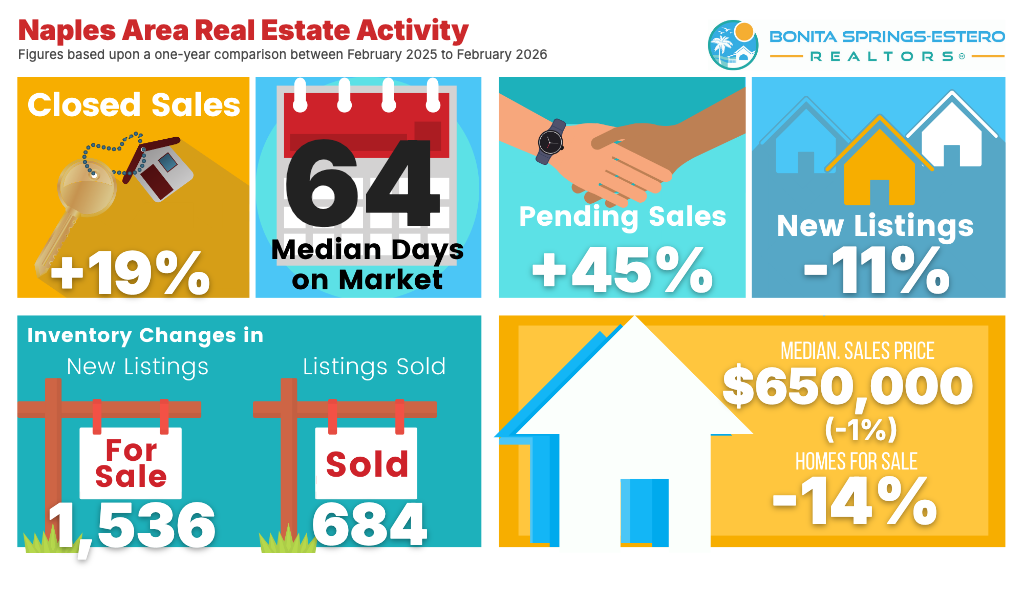
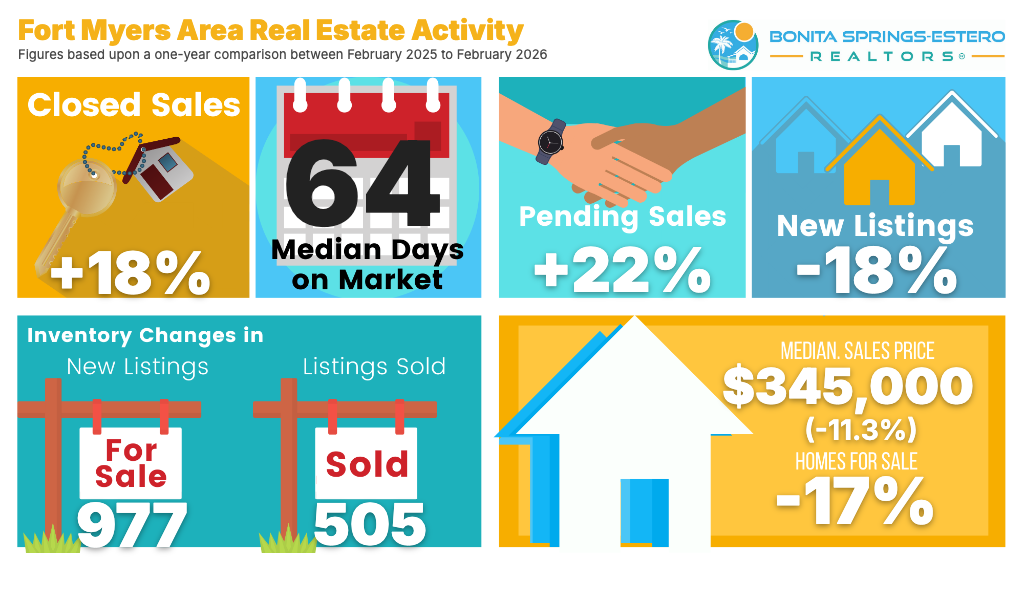
These two markets share the same year-over-year tightening pattern (inventory down, closings up), but price behavior differs.
Naples reported a median sale price of $650,000 (-1.1% YoY) and 9.2 months of supply (-27.5% YoY). Homes for sale decreased from 7,287 to 6,267, while closed sales rose from 577 to 684.
Fort Myers showed the sharpest price adjustment: median sale price $345,000 (-11.3% YoY) with 8.3 months of supply (-30.2% YoY). Homes for sale dropped from 5,062 to 4,178, and closed sales increased from 427 to 505.
In our January 2026 market update, the framework was: winter-season demand stays active, inventory/months-of-supply remain the leverage engine, and the cleanest trend read is year-over-year—not month-to-month.
February supports that thesis:
The twist: January emphasized the broader multi-year inventory rebuild as the underlying negotiation backdrop. February still fits the rebalance narrative, but it does so through a seller pullback in new listings, which can tighten conditions faster than expected in specific neighborhoods and price bands.
A couple of Southwest Florida market commentaries track well with February’s story:
The key takeaway is alignment, not conflict: the outside narrative generally matches what the metrics are showing—demand is real, but it’s disciplined.
If February’s pattern holds, the next 60–90 days are likely to be shaped by three questions:
“Expect continued high-season activity into early spring, with the strongest response in homes that are priced correctly relative to competing inventory and total carrying costs. Watch pendings vs. new listings as early signals: consistent absorption can compress supply and firm up pricing quickly where inventory is tight.”